

Downdetector detects server outages without pinging servers or connecting to a company’s internal infrastructure. Instead, it collects crowdsourced problem reports from its websites, social media platforms, and other web sources, comparing live volume against a rolling 365-day baseline for each 15-minute window. Sustained spikes well above normal trigger an outage alert.
ContentsToggle
Where Downdetector gets its outage signals
Every signal on Downdetector starts with frustrated users rather than server telemetry. The platform has zero direct integration with the hardware, APIs, or status dashboards of the services it tracks, according to the Downdetector API documentation.
When you visit a localized Downdetector page and click to report an issue, the system logs the timestamp, country site, and the specific problem category you pick, such as login failures, app crashes, or server connection errors. It combines those direct website submissions with automated monitoring of social media posts and other web signals.
To plot live outage maps, Downdetector runs each reporter’s IP address through MaxMind GeoIP databases to estimate city, region, latitude, and longitude. On mobile devices, opt-in location permissions refine those coordinates further.
That crowdsourced model depends on scale to catch regional and global disruptions quickly. As of May 2025, Downdetector operated across 64 countries in 26 languages, tracked more than 25,000 services, and reached over 20 million monthly active users, according to Ookla’s 2025 overview.
How the rolling baseline detects server outages
Large online services attract a steady trickle of user complaints even when everything works properly. Someone forgets a password, loses home Wi-Fi, or runs an outdated app version, so a raw count of 50 reports means very different things for a global streaming platform and a small regional bank.
To filter out everyday noise, Downdetector calculates a separate baseline for each service and problem indicator covering every 15-minute slot of the day. Whenever enough history exists, that baseline draws on the previous 365 days of report volume for that exact time window.
When live reports surge past the expected line, the algorithm evaluates both how far the spike exceeds normal volume and how long it lasts. Based on those two factors, the platform assigns one of three statuses:
- No problems, when incoming reports show weak or no evidence of an anomaly.
- Possible problems, when moderate evidence of a disruption persists past brief noise.
- Problems, when strong evidence of elevated reports holds steady across the window.
Ookla keeps the exact mathematical thresholds and scoring weights proprietary. Networking researchers at the USC Information Sciences Institute noted in 2019 that this closed methodology makes it impossible for outside analysts to independently audit Downdetector’s statistical precision.
While consumers see free 24-hour graphs and heat maps on the website, businesses pay for commercial tools like Downdetector Explorer and Downdetector API v2. Those enterprise feeds add AI-generated incident summaries, connections to IT tools like Datadog, Opsgenie, and Slack, and cross-provider correlation across cloud hosts, content delivery networks, and ISPs so engineering teams can tell an internal bug from an upstream provider failure. Telecom carriers can also embed Downdetector Connect widgets inside their customer apps to map complaints onto hexagonal geographic grids.
Crowdsourced reports vs. active network monitoring
Traditional internet monitors work from the opposite direction. Automated systems like IODA and Trinocular send continuous active IPv4 pings, watch Border Gateway Protocol routing tables, and scan passive network telescopes, inferring an outage from the absence of network responses.
Crowdsourced platforms detect failures through the presence of human complaints instead. Comparative networking research published in the Gesellschaft für Informatik digital library showed that user reporting catches application bugs, broken authentication, and DNS misconfigurations even when a company’s servers still answer basic IP pings.
| Method | Primary signal | What it catches fastest | Main blind spot |
|---|---|---|---|
| Crowdsourced monitoring (Downdetector) | User problem reports and social web signals | Login bugs, app crashes, DNS errors, and unannounced outages | Spillover reports, overnight lulls, and no technical root cause |
| Active network telemetry (IODA, Trinocular) | IPv4 pings, BGP routes, and traffic telescopes | Routing blackouts, fiber cuts, and regional ISP shutdowns | Can miss app-layer or login failures if servers stay reachable |
| Official status pages and aggregators (StatusGator, IsDown) | Vendor-published incident updates | Confirmed root causes, affected modules, and official incident IDs | Often lag behind user impact while companies verify issues internally |
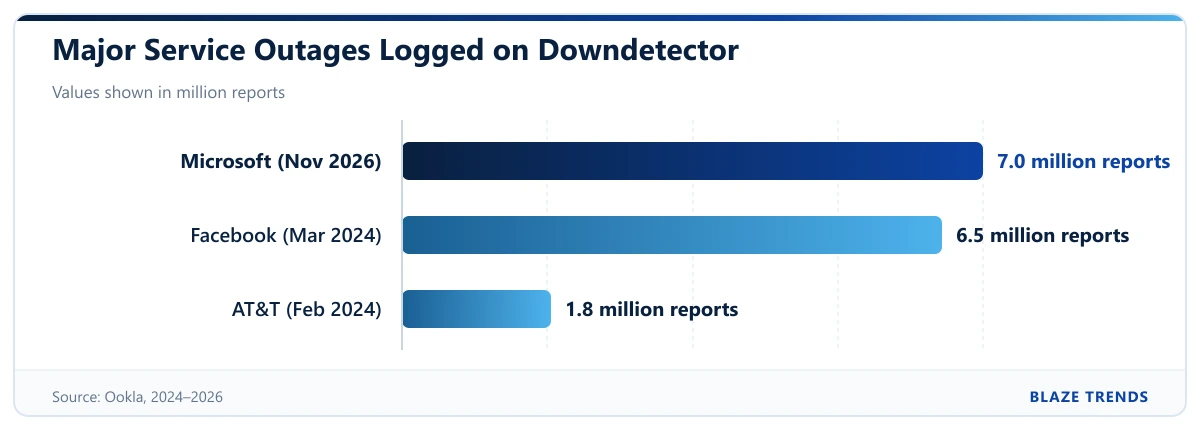
That speed gap shows up sharply during major disruptions. During AT&T’s February 22, 2024 outage, users logged more than 1.8 million reports within hours, according to Ookla’s first-half 2024 report, while AT&T took roughly 16 hours to publicly confirm an internal cause.
Other global outages generate even steeper bursts of crowd data. Ookla recorded more than 6.5 million reports in just over two hours during Facebook’s March 5, 2024 disruption, and more than 7 million reports by 16:00 UTC during Microsoft’s November 13, 2026 outage across more than 90 countries and territories logging at least 1,000 reports each.
Where Downdetector falls short
Relying on human perception creates predictable blind spots that you should keep in mind before assuming a service is dead. One of the most common distortions is cross-network spillover.
During the February 2024 AT&T outage, Verizon and T-Mobile customers flooded their own carriers’ Downdetector pages with problem reports because their calls to AT&T subscribers failed. Both competing networks were running normally, yet their charts spiked alongside AT&T’s.
Report graphs also track human sleep schedules as much as server uptime. During Microsoft’s November 2026 disruption, Ookla observed report volume surging in regional waves between 8 a.m. and 11 a.m. local time over roughly 20 hours as each time zone sat down for work, meaning overnight outages often look deceptively small until morning.
Visual scaling on the homepage can mislead casual readers as well. CNET noted in November 2026 that Downdetector’s homepage sparklines scale individually to each service rather than sharing one vertical axis, so a localized blip of a few hundred reports can look identical to a massive national breakdown sitting right next to it.
Aggregate spikes also struggle to separate partial feature glitches from full shutdowns, a limitation noted in an August 2025 study in the Journal of Accounting and Economics that analyzed licensed Downdetector datasets. If you need confirmed root causes or recovery timelines, an official vendor status page remains the authoritative source once the company acknowledges the problem.
Frequently asked questions
Do user comments on Downdetector increase the outage count?
No. Downdetector runs its page comments through Disqus and excludes those comments from its report totals and outage detection algorithm, according to the Downdetector API documentation. Checking the comment thread is still useful for spotting exact error codes or quick workarounds from other users.
Can Downdetector go down during a major internet outage?
Yes, although its engineers design around single-provider failures. As The Pragmatic Engineer detailed in December 2025 in its look at “Downdetector and the real cost of no upstream dependencies,” the site runs across multiple cloud providers so one cloud outage won’t take it offline, but it still relies on Cloudflare for DNS, CDN caching, bot protection, and DDoS defense during huge traffic surges.
Why can a service show an outage in one country and not another?
Downdetector runs separate localized sites across 64 countries, and each country page calculates its own 365-day baseline and live report volume. A local ISP routing fault or regional server failure will trigger a Problems alert on that country’s site while neighboring countries continue showing No problems.