
The UV Index is calculated by measuring or modeling the strength of solar ultraviolet radiation reaching the ground between 290 and 400 nanometers, multiplying each wavelength by a weighting factor that reflects how easily it sunburns human skin, and summing those weighted values. After adjusting that total for local cloud cover and elevation, meteorologists divide the resulting dose rate in milliwatts per square meter by 25 (or multiply watts per square meter by 40) and round to the nearest whole number.
Scientists at Environment and Climate Change Canada invented the scale in 1992 to turn complex spectrographic radiation data into a simple daily number, according to Environment and Climate Change Canada (2026). In 2002, the World Health Organization, the World Meteorological Organization (WMO), the United Nations Environment Programme, and the International Commission on Non-Ionizing Radiation Protection standardized the calculation globally so a reading of 8 represents the exact same sunburn hazard anywhere on Earth.
Why does the formula weight ultraviolet wavelengths differently?
Sunlight arrives at the top of the atmosphere across three ultraviolet bands: UVC (100 to 280 nanometers), UVB (280 to 315 nanometers), and UVA (315 to 400 nanometers), according to the Hong Kong Observatory (2024). Stratospheric ozone, oxygen, water vapor, and carbon dioxide absorb 100 percent of UVC and roughly 90 percent of UVB before those rays reach the surface, according to the World Health Organization (2002). Because wavelengths shorter than 290 nanometers are completely filtered out aloft, ground-level UV calculations only cover the spectrum from 290 to 400 nanometers, according to the US Environmental Protection Agency (2026).
Measuring raw light energy across that band is not enough on its own, because human skin does not react equally to every wavelength. Shorter UVB wavelengths trigger erythema—the clinical term for sunburn reddening—far more aggressively than longer UVA wavelengths of the exact same physical intensity, according to the US EPA (2026).
To weight sunlight by biological skin damage rather than raw wattage, meteorologists multiply the irradiance at each wavelength by the McKinlay-Diffey erythemal action spectrum, standardized by the International Commission on Illumination in 1998 as CIE S007/E-1998 (Hong Kong Observatory, 2024). According to the International Agency for Research on Cancer (2018), the weighting curve assigns its maximum damage factor of 1.0 to all wavelengths of 298 nanometers and shorter. Between 298 and 328 nanometers, the weight drops exponentially according to 10 raised to the power of 0.094 times (298 minus the wavelength in nanometers), and from 328 to 400 nanometers it drops further at 10 raised to the power of 0.015 times (139 minus the wavelength), according to the International Agency for Research on Cancer (2018).
Once those weighted values are integrated (summed) across the 290-to-400-nanometer spectrum, the total erythemal irradiance is expressed in watts per square meter or milliwatts per square meter. Under the WMO standard, 1 UV Index unit equals 25 milliwatts per square meter of erythemally weighted UV radiation, which is mathematically identical to multiplying watts per square meter by a constant of 40 square meters per watt (University of California, 2000; Hong Kong Observatory, 2024). Canadian researchers originally picked 25 milliwatts per square meter as the divisor in 1992 because a clear summer midday reading in Toronto reached roughly 250 milliwatts per square meter, creating a clean 0-to-10 reference scale for mid-latitudes (Environment and Climate Change Canada, 2026).
How weather agencies calculate the daily UV Index forecast
When you check a morning weather app, the forecasted UV peak comes from atmospheric computer models rather than a live ground sensor. In the United States, the National Weather Service and US EPA calculate how the UV Index will peak around solar noon using a five-step sequence (US EPA, 2026):
- Determine clear-sky ground irradiance from 290 to 400 nanometers by feeding satellite ozone measurements from the NOAA Ozone Mapping and Profiler Suite (OMPS), the solar zenith angle (set by latitude, date, and time of day), and a semi-annual tropospheric aerosol climatology into a radiative transfer model, according to the NOAA Climate Prediction Center (2025).
- Multiply the modeled UV intensity at each wavelength between 290 and 400 nanometers by its McKinlay-Diffey erythemal weighting factor to account for human skin sensitivity (US EPA, 2026).
- Integrate those weighted values across the 290-to-400-nanometer band to find the total clear-sky, sea-level erythemal dose rate in milliwatts per square meter (US EPA, 2026).
- Adjust the clear-sky total for local elevation by adding 6 percent per kilometer above sea level (roughly 2 percent per 1,000 feet) and multiply by the forecasted cloud transmission rate (US EPA, 2026; WebMD, 2024). In National Weather Service Model Output Statistics calculations, 100 percent clear skies transmit 99.9 percent of UV rays, scattered clouds transmit 89.6 percent, broken clouds transmit 72.6 percent, and overcast skies transmit 31.6 percent (University of California, 2000).
- Divide the adjusted dose rate in milliwatts per square meter by 25 and round to the nearest whole number to get the final UV Index (US EPA, 2026).
A worked example from the US EPA (2026) shows how those adjustments change the final score. Suppose the integrated, skin-weighted clear-sky UV irradiance at sea level equals 280 milliwatts per square meter. For a city located 1 kilometer above sea level (multiplying by 1.06) under broken clouds that transmit 73 percent of incoming UV (multiplying by 0.73), the surface dose rate drops to 280 times 1.06 times 0.73, or 216.7 milliwatts per square meter (US EPA, 2026). Dividing 216.7 by 25 produces 8.668 (8.7), which rounds to a reported UV Index of 9 (US EPA, 2026).
How do ground sensors measure the live UV Index?
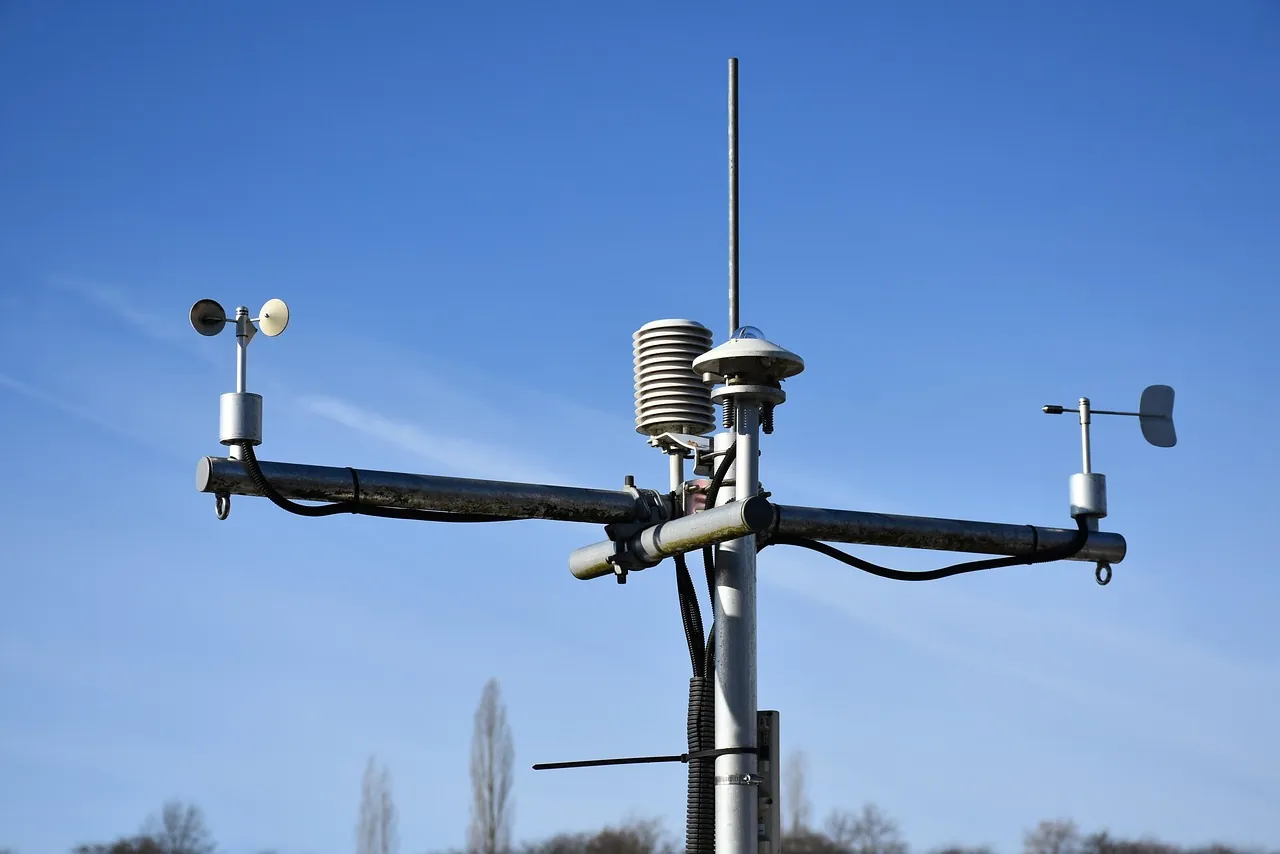
Alongside computer forecasts, meteorological networks measure live surface UV readings throughout the day. Instead of scanning every nanometer individually with a laboratory spectroradiometer, weather stations such as the Hong Kong Observatory (2024) use broadband UV sensors fitted with optical filters whose physical response mimics the CIE erythemal curve of human skin.
To smooth out brief flickers from passing clouds, the World Health Organization (2002) specifies two averaging windows for station data. Official daily maximum reports represent a 30-minute average centered around solar noon, whereas live continuous readings display a 5-to-10-minute average (World Health Organization, 2002).
While the radiative physics of stratospheric ozone absorption are well established, real-world aerosol plumes, shifting cloud edges, and broadband sensor calibration still create measurement spread. According to the International Agency for Research on Cancer (2018), field broadband UV instruments carry a measurement uncertainty of around 30 percent compared with reference spectroradiometers. On the modeling side, National Weather Service daily forecasts validated against ground stations fall within plus or minus 1 UV Index unit 68 percent of the time during summer months (University of California, 2000). At the NOAA Climate Prediction Center (2025), operational models still use a semi-annual climatology for lower-atmosphere haze while researchers work to assimilate daily observed aerosol data.
What do people get wrong about UV Index numbers?
Once the integer is calculated, weather agencies map it onto five standardized exposure tiers, much like impact-based weather warning levels turn raw meteorological metrics into clear public alerts. Both the World Health Organization (2022) and Environment and Climate Change Canada (2026) list the categories as Low (0 to 2), Moderate (3 to 5), High (6 to 7), Very High (8 to 10), and Extreme (11 and above). The US EPA (2026) uses the same five color-coded tiers (green, yellow, orange, red, and violet), though it describes the daytime scale as running from “1 (low) to 11 or more” and reserves 0 for night or minimal sunlight.
Even with a simple scale, four common misconceptions routinely catch people off guard outdoors:
- Air temperature does not enter the UV formula. Because solar angle, ozone thickness, and elevation drive the math, a cool spring day or cold mountain morning can carry a much higher UV Index than a hot autumn afternoon (WebMD, 2024; Health Canada, 2026). At 2,000 meters of elevation, UV intensity can run up to 30 percent higher than at sea level (Health Canada, 2026).
- Clouds do not always reduce UV exposure. Dark, water-heavy storm clouds can absorb up to 80 percent of UV rays, and complete overcast still transmits roughly 31 percent (Health Canada, 2026; WebMD, 2024). However, scattered fair-weather clouds can deflect and reflect sunlight, temporarily pushing ground-level UV above clear-sky levels (Health Canada, 2026).
- Standard forecasts measure radiation falling from the sky onto a horizontal sensor, leaving out ground reflection (albedo). Water reflects about 10 percent of UV radiation, dry beach sand reflects 15 percent, and fresh white snow reflects 80 to 85 percent (WebMD, 2024; Health Canada, 2026). According to Health Canada (2026), snow reflection nearly doubles your exposure, turning a forecasted UV Index of 4 while spring skiing into an effective UV Index of 7 on your skin and eyes.
- The score is not a safe tanning timer. The World Health Organization (2002) warns against converting the UV Index into fixed “time-to-burn” charts because skin types vary and cumulative UV exposure damages DNA and eyes even without a visible sunburn.
Public health agencies recommend wearing broad-spectrum SPF 30 or higher sunscreen, UV-blocking sunglasses, and a wide-brimmed hat while seeking shade whenever the UV Index hits 3 or higher (World Health Organization, 2022; Health Canada, 2026). Midday protection matters most during the four hours around solar noon (10 a.m. to 2 p.m. under World Health Organization guidance, or 11 a.m. to 3 p.m. from April to September under Health Canada guidelines). If you take medications that increase sun sensitivity or notice new or changing spots on your skin, consult a doctor or dermatologist for personalized medical guidance.
Frequently asked questions
What is the highest possible UV Index?
The scale is open-ended and has no upper limit (World Health Organization, 2002). While readings of 11 or higher fall into the Extreme category and are rare in Canada, the index regularly reaches 14 or higher across the tropics and the southern United States, and climbs highest in high-altitude, cloudless, low-ozone regions like Chile’s Atacama Desert (Environment and Climate Change Canada, 2026; WebMD, 2024).
Does the UV Index include both UVA and UVB rays?
Yes, integrating from 290 to 400 nanometers captures both UVB (280 to 315 nanometers) and UVA (315 to 400 nanometers) reaching the ground (US EPA, 2026; Hong Kong Observatory, 2024). Because the McKinlay-Diffey erythemal spectrum weights shorter wavelengths much more heavily than longer ones, UVB accounts for most of the final score (International Agency for Research on Cancer, 2018).
How can you estimate UV strength without a weather app?
Meteorologists and the US EPA recommend the Shadow Rule when you cannot check a forecast (WebMD, 2024). Stand on level ground and check your shadow: if it is shorter than your height, the sun is high enough in the sky that UV rays are intense and you should take sun precautions (WebMD, 2024).