
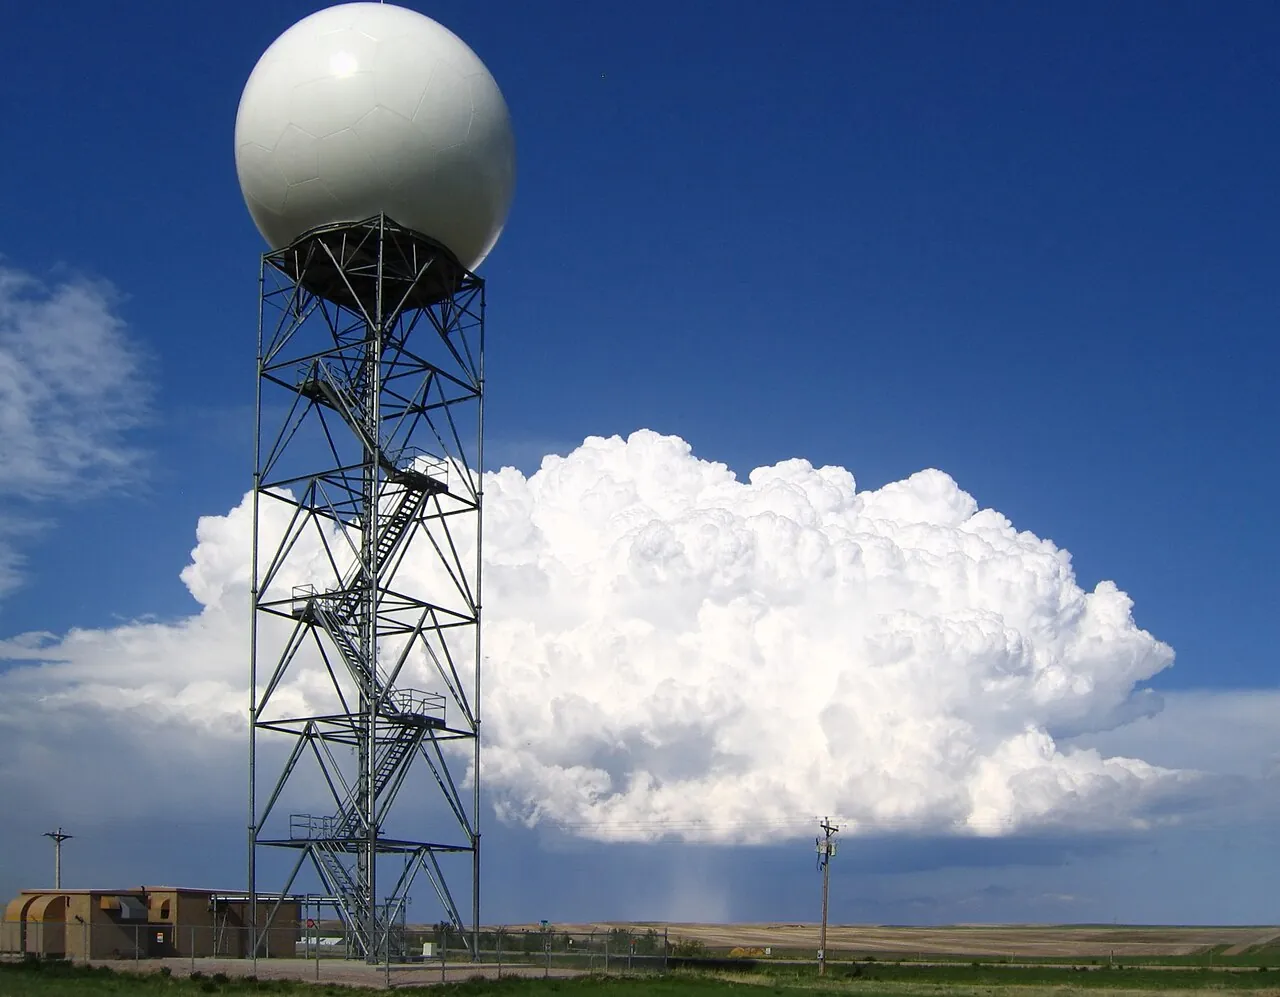
Doppler weather radar tracks an approaching tropical cyclone by firing microwave pulses that bounce off raindrops inside the storm’s spiral bands and eyewall. By measuring the strength of the returning echo (reflectivity) and the phase shift caused by moving raindrops (the Doppler effect), the radar maps the cyclone’s center, rainfall intensity, and internal wind speeds up to 230 to 460 kilometers (143 to 286 miles) from the coast.
Satellite imagery can spot a developing storm thousands of kilometers out at sea, but satellites mainly see the tops of clouds. Once a hurricane, typhoon, or cyclonic storm moves within coastal range, ground-based Doppler radar looks directly inside the storm’s lower levels, giving forecasters continuous updates on where the eyewall is heading and how intense the winds are beneath the cloud canopy.
How does a pulsed Doppler weather radar scan a cyclone?
A modern weather radar spends almost all of its operating time listening rather than transmitting. On the WSR-88D network operated by the US National Weather Service (2023), the transmitter fires bursts of radio energy at roughly 750,000 watts up to 1,300 times per second, yet those microscopic pulses add up to only about 7 seconds of transmission per hour. For the remaining 59 minutes and 53 seconds of every hour, the dish listens for faint echoes bouncing back from raindrops, hail, and ice crystals.
To build a three-dimensional picture of a cyclone, the radar antenna rotates 360 degrees inside its protective dome following a preset sequence called a Volume Coverage Pattern (VCP), according to NWS documentation (2023). The dish starts at an elevation angle of 0.5 degrees above the horizon, completes a full rotation, and then steps upward through higher tilts such as 1.5, 2.4, 3.4, and 4.3 degrees. Completing a full volume scan across all tilts takes between 4 and 7 minutes.
When a tropical cyclone approaches land, conditions near the ground change too quickly to wait 7 minutes between low-level views. Under the Supplemental Adaptive Intra-Volume Low-Level Scan (SAILS) mode used by the NWS (2023), the dish interrupts its upper-level sweep to return to the 0.5-degree base angle every 75 to 90 seconds. That rapid update cycle helps meteorologists track sudden wobbles in the storm’s track and spot fast-spinning tornadoes embedded in the outer rainbands.
How does reflectivity locate the eye and eyewall?
Every microwave pulse that hits precipitation scatters energy back toward the radar dish, and the receiver measures the travel time to calculate the exact distance. According to NOAA JetStream reflectivity training (2023), the radar converts the raw power of that returned echo into a logarithmic decibel scale called dBZ, which spans from -35 dBZ in clear air to +85 dBZ in extreme hail or torrential downpours. On a standard radar map, readings between 50 and 65 dBZ mark heavy rainfall, while values above 65 dBZ indicate extreme precipitation.
Because a mature tropical cyclone organizes its rainfall into distinct concentric zones, reflectivity maps make the storm’s anatomy immediately visible. According to the India Meteorological Department cyclone warning manual (2021), coastal radar reveals four horizontal structural regions as a storm approaches shore:
- The eye at the center of the cyclone, a calm, nearly rain-free circular zone measuring 10 to 50 kilometers across where radar reflectivity drops to near zero.
- The eyewall directly surrounding the eye, a 10-to-15-kilometer-thick ring of deep convective clouds reaching 10 to 15 kilometers high that produces the cyclone’s heaviest rain and strongest winds.
- Spiral rainbands curving outward from the eyewall like a pinwheel, feeding warm, moist air into the core while bringing squalls and tornadoes to the coast hours before landfall.
- The outer storm area surrounding the spiral bands, where lighter, more scattered showers wrap around the system’s periphery.
Forecasters pinpoint the exact center of the cyclone by tracking the clear geometric center of the eye on base reflectivity scans (which show the single 0.5-degree tilt) and composite reflectivity scans (which combine the highest dBZ values from every elevation angle). In the IMD’s standard operating procedure (2021), meteorologists also measure the Radius of Maximum Reflectivity (RMR) inside the eyewall because it coincides directly with the Radius of Maximum Wind (RMW), marking the ring of fiercest surface gusts.
How does Doppler radar measure cyclone wind speeds?
Standard weather radar can only see where rain is falling, but a Doppler radar also measures how fast those raindrops are being blown by the wind. Inside the transmitter, a klystron amplifier and a stable local oscillator keep every outgoing microwave pulse phase-coherent, according to the India Meteorological Department’s Pune training division (2021). When a pulse bounces off a raindrop moving toward the radar dish, the returning wave is compressed to a slightly higher frequency; when the raindrop is moving away, the wave is stretched to a lower frequency.
By comparing the phase shift between outgoing and returning pulses, the radar calculates the target’s radial velocity, the speed at which precipitation moves directly parallel to the radar beam. On standard NOAA JetStream velocity displays (2023), green and blue pixels represent inbound winds blowing toward the radar site, while red and yellow pixels represent outbound winds blowing away from the dish.
When a tropical cyclone enters Doppler range, its rotating eyewall creates a vivid signature known as a velocity couplet. Because winds spiral around the low-pressure center (counterclockwise in the Northern Hemisphere and clockwise in the Southern Hemisphere, per IMD documentation (2021)), one side of the eyewall blows straight toward the coastal radar while the opposite side blows straight away. That produces a bright patch of high-speed inbound greens right next to a bright patch of high-speed outbound reds, framing the eye in between. Agencies rely on these real-time wind readings alongside aircraft and surface observations to apply India Meteorological Department cyclone classifications and issue coastal alerts.
To spot smaller, violent rotations hidden inside the broader hurricane-force flow, forecasters switch from Base Velocity to Storm Relative Velocity. As NOAA JetStream (2023) and NWS Cleveland (2023) explain, this product subtracts the cyclone’s overall forward motion from the wind map. What remains are tight, localized inbound-and-outbound couplets—called mesocyclones—inside the outer spiral rainbands, allowing meteorologists to issue tornado warnings for specific coastal communities while the main cyclone is still offshore.
What are the limits and misconceptions of tracking cyclones by radar?
Even the most powerful coastal Doppler radar cannot see true wind speeds everywhere in a storm, and reading a radar velocity map without accounting for beam geometry leads to three common mistakes:
- Thinking the radar measures wind in all directions: Doppler radar only detects motion directly along the line of sight of its beam. Where the cyclone’s circular winds blow at a 90-degree angle perpendicular to the radar beam, the radial velocity reads zero—creating a gray S-shaped band across the storm called the zero isodop, according to NOAA JetStream (2023), even though violent winds are blowing across the beam.
- Assuming radar shows ocean-surface winds far offshore: Under normal atmospheric conditions, a radar beam bends slightly less than the curve of the Earth. According to NOAA JetStream’s radar beam guide (2023), a beam leaves the dish at a 0.5-degree angle and spreads out by roughly 1,000 feet for every 10 miles of travel. At a distance of 100 miles (160 kilometers), that lowest beam is nearly 2 miles wide and is sampling winds nearly 12,000 feet (3.6 kilometers) above the ocean surface rather than at sea level.
- Expecting wind readings at the same distance as rainfall maps: There is an engineering trade-off between how far a pulsed radar can see and the maximum wind speed it can measure without ambiguity. On the US WSR-88D network, long-range reflectivity reaches out to 248 nautical miles (460 kilometers), according to NOAA JetStream’s radar glossary (2023), whereas Doppler velocity measurements stop at 124 nautical miles (230 kilometers). Similarly, the IMD’s coastal radar network (2021) tracks reflectivity out to 500 kilometers on Plan Position Indicator (PPI) scans, while radial velocity coverage extends to roughly half that distance.
The microwave frequency a weather agency chooses also dictates how well its radar sees through a cyclone’s core. According to the World Meteorological Organization’s operational weather radar guidance (2024) and WMO/NOAA tropical cyclone workshop documentation (2016), coastal cyclone networks rely primarily on S-band radars operating at 2,700 to 2,900 megahertz (a 10-centimeter wavelength). Those 10-centimeter waves pass through torrential eyewall downpours with almost no signal loss (attenuation), illuminating the far side of the storm up to 300 to 500 kilometers away. C-band radars (5,600 to 5,650 megahertz, or a 5.4-centimeter wavelength) cost roughly half as much and track rain up to 200 kilometers, but heavy cyclone rain weakens their shorter waves beyond 100 kilometers. Compact X-band radars (9,300 to 9,500 megahertz, around 3 centimeters) lose their signal quickly in heavy rain and are used only for short-range gap-filling within about 50 kilometers.
When a tropical cyclone is still hundreds of kilometers out to sea beyond coastal S-band range, forecasters bridge the gap from the air. According to the NOAA Hurricane Hunters operations page (2024), WP-3D Orion reconnaissance aircraft fly directly through the eyewall carrying an onboard tail Doppler radar and dropping GPS dropwindsondes, mapping the storm’s three-dimensional wind structure days before coastal dishes pick up the first outer rainbands.