Yesterday was another interesting day for bitcoin (BTC). The price fell slightly again but bounced back to the level we signed in the morning update of June 28. The support line has thus far performed as expected. That the price has fallen has not gone unnoticed for the whales. Neither is the largest institutional whale we know, namely Microstrategy. They have again bought 480 BTC.
However, there was also slightly less good news following the decline in bitcoin, namely the demise of one of Compass Mining’s mining operations. Due to the falling price, this location was no longer profitable and they could not pay their energy bills.
This is what happened to the bitcoin price while you were sleeping
Bitcoin is down 1.5% since 00:00. The current price at the time of writing is $19,950 on crypto exchange Coinbase. The euro price of bitcoin is €19,063 on the Dutch exchange bitvavo†
Bitcoin has fallen 0.7% in value in the past 24 hours. Trading volume also declined 0.7% over the same time frame. Bitcoin has fallen 1.7% in value over the past seven days. The total market value of Bitcoin at the time of writing is $381 billion. Compared to the total crypto market cap, the bitcoin dominance comes out at 42.9%, slightly lower than 24 hours ago.
Higher highs and higher lows for bitcoin
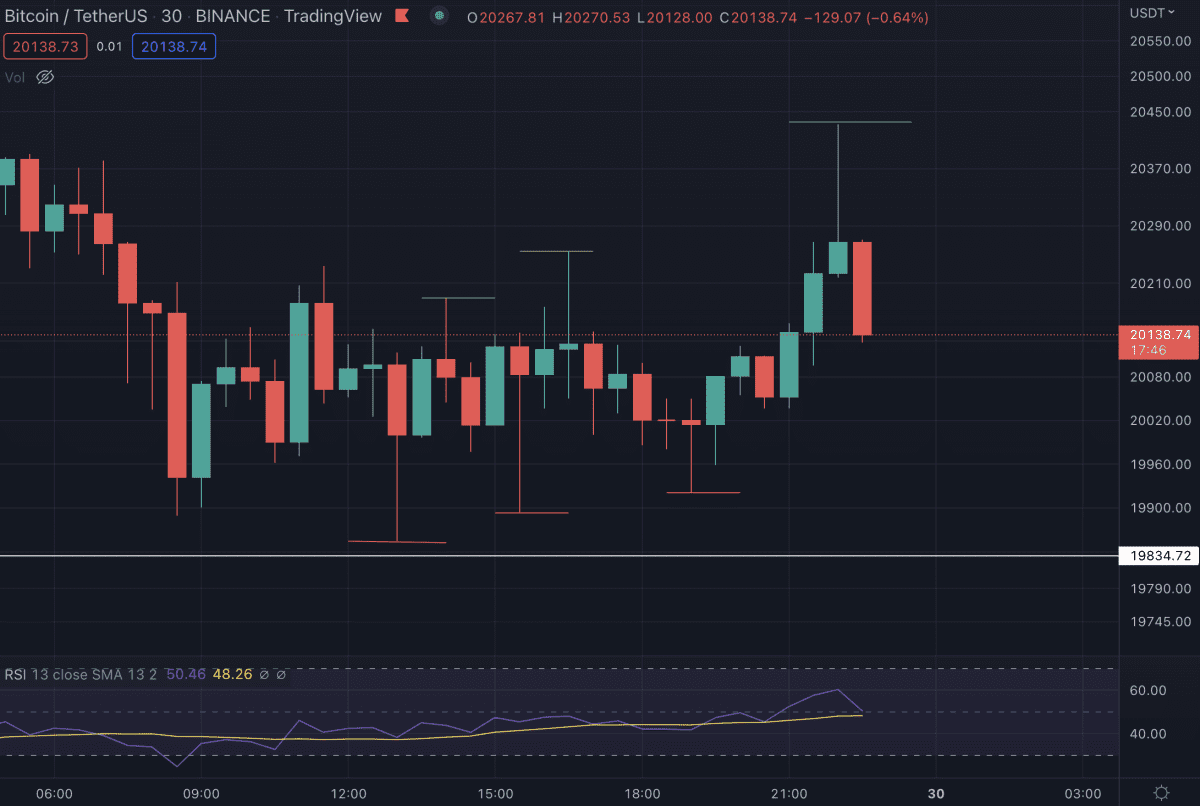
An analyst from the YouTube channel TheChartGuys recently shared an analysis of bitcoin in his livestream. In it, he looked at the price of bitcoin on the lower timeframe and noticed a very interesting pattern that could potentially cause the price to move up again. 
In the livestream, he first looked at bitcoin on the 30-minute chart, which means that each block on the chart is half an hour long. Here he noticed that the price was a high low, higher high pattern, or that the price continued to set a higher bottom and a higher peak. This can also be seen in the graph below.
This has caused the price to break out on the 4 hour chart. What we will have to look out for next is whether there is a new lower peak (lower high) is created on this timeframe.
If this is the case, we will stay for the time being bearish and could we possibly eventually sink to the levels like we are in the Discord environment have indicated.
To make a higher peak (higher high) we need to move towards USD 21,200. This could potentially be a tough task. Should this happen, we could potentially turn bullish in the medium term.
Premium crypto analysis of the day: XRP
Yesterday, the analysts of Crypto Insiders in the Discord environment shared a new analysis of Ripple (XRP). This shows that XRP could potentially be dangerous for the bulls for the time being. The price appears to be making an Elliott Wave 12345 pattern, where we are currently finishing the downward 5th wave. This could eventually lead to interesting possibilities.
The full analysis and updates for XRP can be found in the Discord environment† You can also get in touch directly with experienced traders who are ready to answer all your questions.
To answer the question whether this is the right time to buy or sell, we would like to refer you to our Discord group for members. Here, experienced analysts and traders discuss their own entry and exit points on a daily basis. We are also the first to share our technical and fundamental analyses. In our Discord community we can share knowledge with each other 24/7 and we try to stay ahead of the market together with premium members.

