
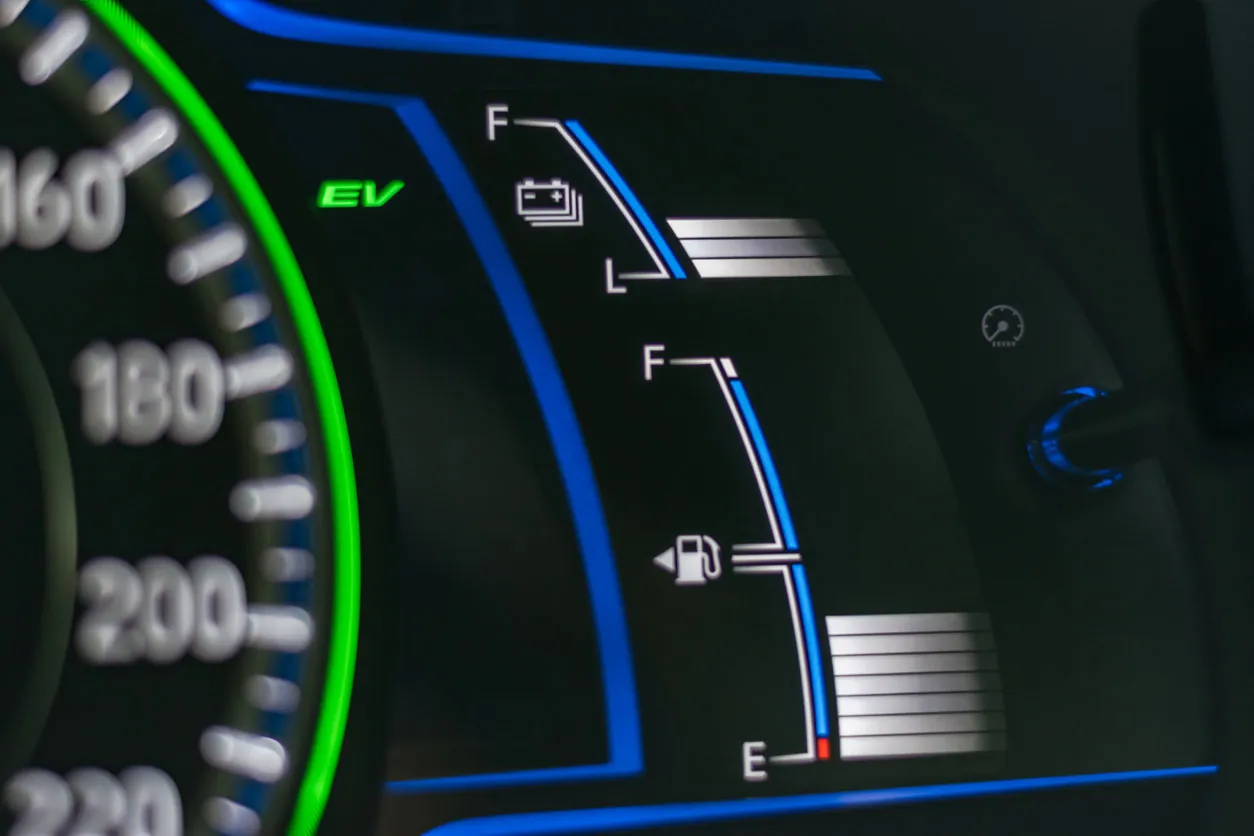
Electric vehicle range estimates tell you exactly how far a car can drive on a single full charge before the battery dies completely. These numbers do not come from real drivers on open highways, but from highly controlled laboratory tests where vehicles run on a chassis dynamometer, which is essentially a giant treadmill for cars. Automakers use three major global testing systems to find these numbers: the Environmental Protection Agency (EPA) standard in the United States, the Worldwide Harmonised Light Vehicle Test Procedure (WLTP) in Europe and other global markets, and the China Light-Duty Vehicle Test Cycle (CLTC) in China.
The problem is that the exact same car will show completely different range numbers depending on which laboratory system tested it. Laboratory tests try to mimic real conditions, but they often use perfect temperatures and gentle speeds that do not match daily commutes. Because battery power depends heavily on speed, air resistance, and outdoor weather, understanding how these official metrics are created helps buyers choose the right vehicle and avoid sudden battery depletion on long trips.
Testing Standards Compared
Every major automotive market relies on a specific laboratory standard to verify efficiency. The official EPA testing guidelines show that the American system is the most conservative because it forces cars through multi-cycle routines and then applies a mandatory reduction to the final numbers. European and Chinese systems utilize different driving patterns that generate much higher estimates for the exact same vehicles. The table below details the structural variations between these three regulatory setups.
| Testing Standard | Primary Region | Test Environment Temperature | Average Speed & Cycle Style | Real-World Realism Rating |
|---|---|---|---|---|
| EPA | United States | Variable (Includes cold/hot cycles) | High-speed highway focus with city mix | Most accurate for highway driving |
| WLTP | Europe / Global | Fixed at 23°C (73°F) | Four speed phases from slow to extra-high | Moderately optimistic, good for cities |
| CLTC | China | Fixed room temperature | Slow, stop-and-go urban traffic simulation | Highly optimistic, poor for highways |
The differences in these numbers stem directly from how the laboratories build their simulated trips. For example, according to data published by the EV Database team, the WLTP test runs for exactly 30 minutes over a simulated distance of roughly 23 kilometers. The test splits into low, medium, high, and extra-high speed parts to copy European highway habits. But because the temperature stays perfectly warm throughout the test, the battery performs at absolute peak efficiency during the entire run.
China took a different path when creating its regional testing system. The Chinese urban landscape features dense traffic jams and lower legal speed limits in major metropolitan areas. Because of this, their system leaves out high-speed highway cruising entirely. The vehicle spends most of its lab test slowing down and speeding up at low velocities. Electric cars consume less energy at low speeds because aerodynamic drag is very low, which is why Chinese test metrics are always the highest on paper.
The American EPA approach is much tougher on the vehicle. Testers run the car through city and highway driving schedules repeatedly. Once the raw laboratory number is recorded, the EPA typically multiplies that number by 0.7 to artificially lower the final advertised range. This mandatory reduction acts as a buffer to protect consumers from over-promising, making the American number the toughest to achieve but the closest to actual highway usage.
Common Issues and Real-World Range Drops
The biggest issue with official window stickers is the complete loss of efficiency when driving at sustained high speeds. Air resistance rises exponentially as a vehicle goes faster. A car driving at 75 miles per hour encounters far more physical drag than a car driving at 45 miles per hour. Because electric motors do not have multi-speed transmissions like gasoline engines, they must spin faster and consume significantly more current to maintain highway speeds, causing battery levels to plummet far quicker than the laboratory charts suggest.
Cold weather creates another severe drop in performance that lab tests routinely miss. Lithium-ion batteries rely on liquid electrolytes to move ions between the internal anodes and cathodes. When the outdoor temperature drops below freezing, this liquid thickens, slowing down the chemical reaction and increasing internal resistance. Drivers often see their available driving distance drop by twenty to thirty percent during winter months simply because the battery cannot deploy its stored energy efficiently.
Cabin heating destroys efficiency even further in cold environments. Gasoline vehicles heat the cabin using wasted thermal energy from the combustion engine, which costs no extra fuel. Electric cars must generate every bit of cabin heat directly from the main high-voltage traction battery. If a vehicle uses a traditional resistive heater, turning on the climate control can sap thousands of watts of power continuously, leaving less energy available to turn the wheels. Many modern cars use heat pumps to mitigate this, but the energy drain remains a constant challenge.
Vehicle weight and tire selection also degrade real-world distance numbers instantly. Heavy cargo loads force the electric motor to pull more current during acceleration phases. Furthermore, large luxury wheels with sticky performance tires increase rolling resistance against the asphalt. If a buyer replaces original low-rolling-resistance factory tires with cheaper standard tires, they can experience an immediate five to ten percent reduction in overall driving distance per charge.
Alternative Tools and Methods for Accurate Estimation
Drivers who want real metrics instead of laboratory guesses have several alternative methods to find accurate values. You can read the J.D. Power report on metrics to see how historical testing systems failed consumers, which led to the creation of independent real-world tests. Many automotive media outlets now conduct standardized highway tests at fixed speeds to see how far a vehicle travels before dying.
Math provides a quick way to convert optimistic international numbers into realistic baselines. As detailed in an analysis by InsideEVs editors, you can generally get a realistic estimate by dividing the European WLTP number by 1.12 to find a rough EPA equivalent. For Chinese metrics, multiplying the high number by 0.70 gives a much safer estimate of how the car will perform during regional highway commuting.
On-board trip computers offer the best localized data because they track real-time energy use. These systems look at your consumption in watt-hours per mile. By dividing the total usable kilowatt-hour capacity of your battery pack by your current watt-hour usage rate, the dashboard update continuously recalculates how much distance remains based on your personal driving habits rather than government baselines.
Third-party route planning applications also help eliminate range anxiety on long road trips. These programs connect directly to real-time weather stations, topography maps, and wind speed databases. They calculate exactly how much energy a vehicle will use to climb specific mountain passes or push through heavy headwinds, telling the driver exactly where to stop and plug in before the battery reaches zero.
Frequently Asked Questions
Why does my car show less range than the official window sticker says?
Official estimates come from mild laboratory environments without wind, hills, or freezing weather. Fast highway driving, cold winter ambient air, running the air conditioning, and utilizing aggressive acceleration all drain the battery much faster than the laboratory treadmill setups simulate.
What is the difference between EPA and WLTP estimates?
The EPA standard is used in the United States and includes a mathematical reduction factor to make the final numbers more conservative. The WLTP standard is used in Europe and conducts tests at a constant warm room temperature of 23 degrees Celsius without reducing the final numbers, making its results roughly ten to fifteen percent higher than EPA ratings.
How does cold weather affect electric vehicle distance metrics?
Cold temperatures slow down the internal chemical reactions inside lithium-ion battery cells, reducing their ability to hold and discharge energy. Additionally, running the electric cabin heater pulls energy directly from the main battery pack, which can reduce total driving distance by up to thirty percent in sub-freezing conditions.
Why are Chinese testing metrics so much higher than American ones?
The Chinese system focuses heavily on slow, stop-and-go urban traffic patterns with very low average speeds. Because electric vehicles are incredibly efficient at slow speeds where aerodynamic drag is minimal, this testing method produces the highest and most optimistic driving distance estimates in the automotive industry.
Does using the car battery for phone charging reduce driving distance?
Charging minor electronic accessories like smartphones or tablet devices uses an incredibly small amount of power from the low-voltage accessory system. This auxiliary draw is so microscopic compared to the energy required to move a multi-ton vehicle that it has no measurable impact on your total available driving distance.